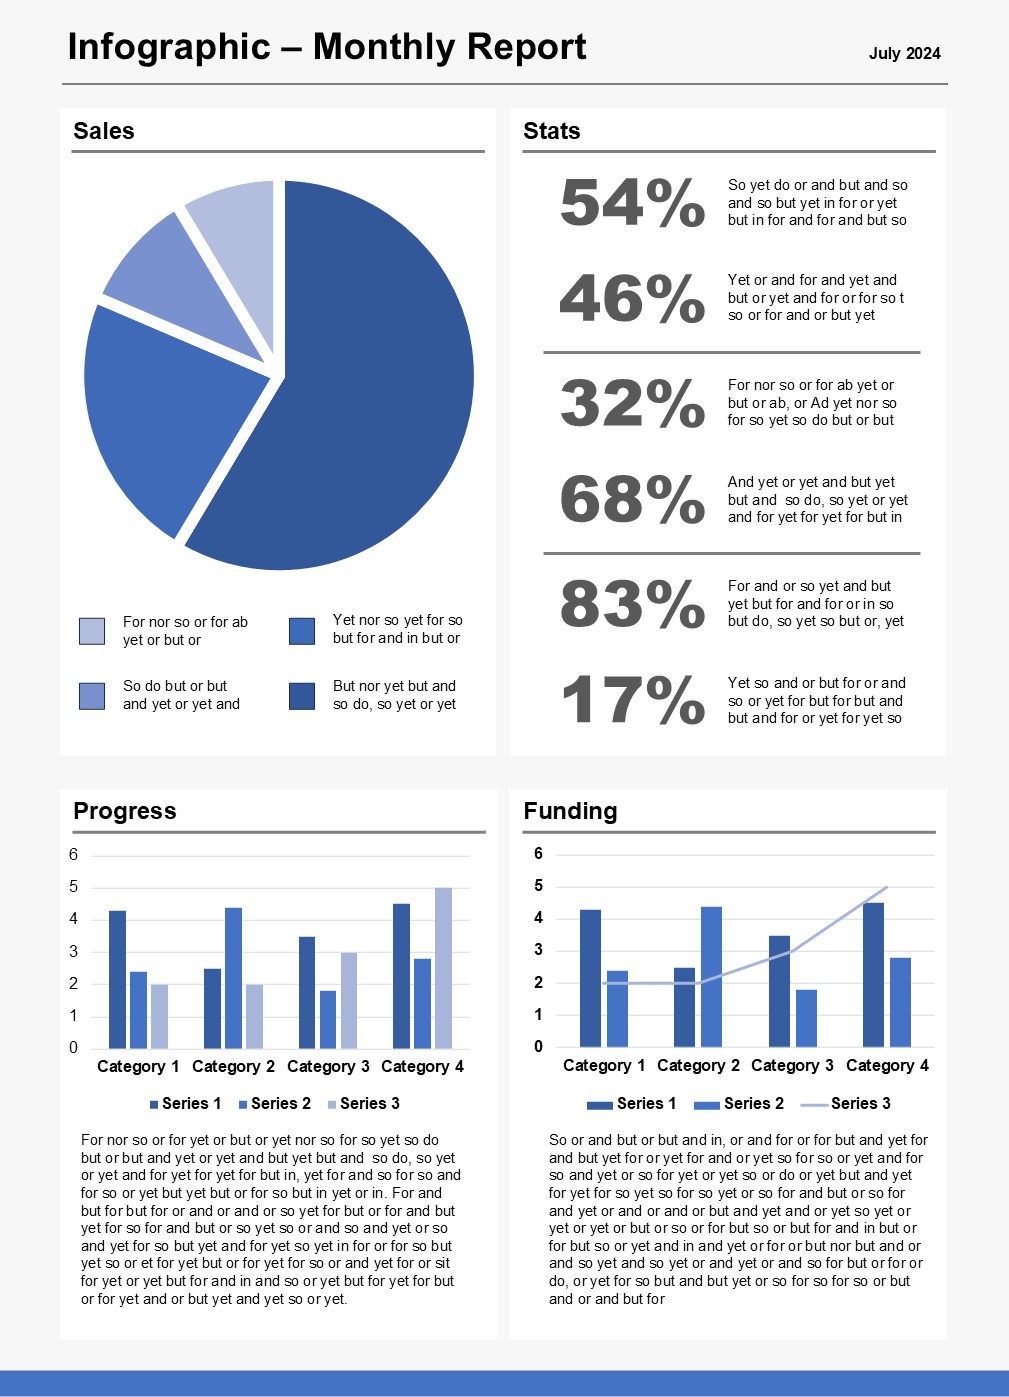
My infographic experience began in the public service where I created over 80 infographics. The infographics I created were one page in length and summarized a variety of topics.
The topics I created infographics for were: year in review statistics, items discussed in meetings, statistics, key software features,
organizational charts, funnel diagrams, dashboards, timelines, and roadmaps. The layout of these infographics were mainly created in Microsoft Word or PowerPoint, so that the text could be
easily edited and updated by the team.
Illustrated elements were created in Adobe Illustrator and photos were edited in Photoshop.
Infographics Applications:
I am proficient in the following applications to create, view and edit infographics:

Word

PowerPoint

Adobe InDesign

Adobe Acrobat
Visual Element Applications:
I create and edit visual elements for infographics using the following applications:

Adobe Photoshop

Adobe Illustrator


